In this post we are going to talk about the Long Legged Doji candlestick pattern what it’s significance is when it appears. Gold is a market that many traders love to trade. In our post on Friday we told you about the Double Top Pattern being formed on the daily timeframe. We said if we have a bearish daily candle formed today then we have a confirmed downtrend on gold XAUUSD. Gold price topped at $1263 per ounce. Now it is going to drop and drop. Take a look at the following daily chart.
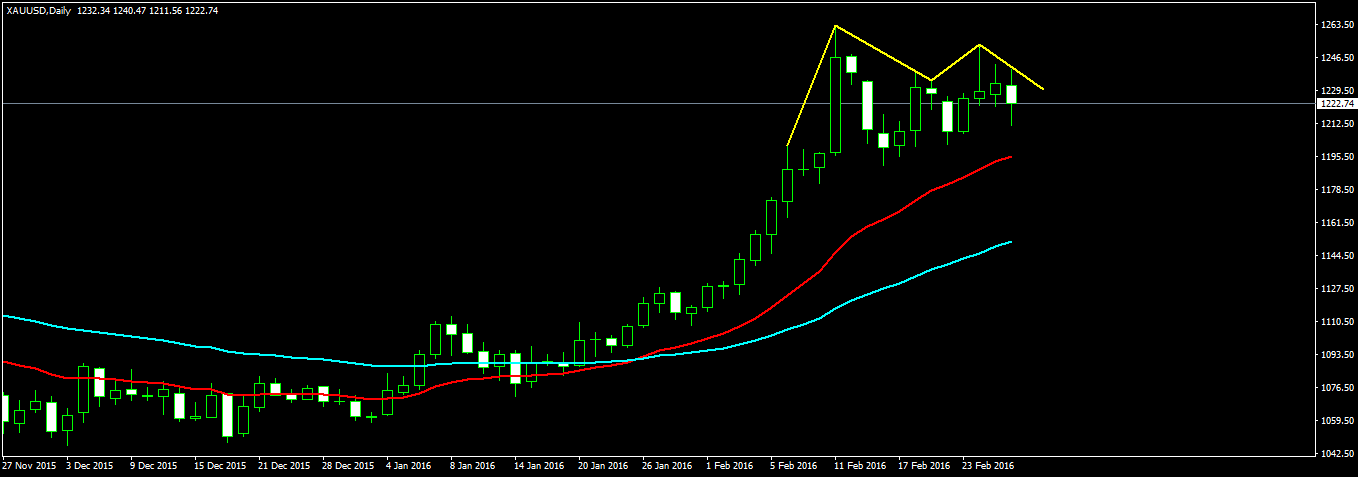
In the above screenshot you can see the Double Top Pattern also known as the M pattern clearly market. You can clearly see the last daily candle to be bearish. If you didn’t read out last post on XAUUSD Gold, you should read it now before you continue with this post. Gold price could not go above rather it went down. In the last post we told you that there are analysts who are predicting that gold price will fall down below $1,000 per ounce. In this post post we show you how this is possible using the power of technical analysis. Take a look at the weekly chart below.
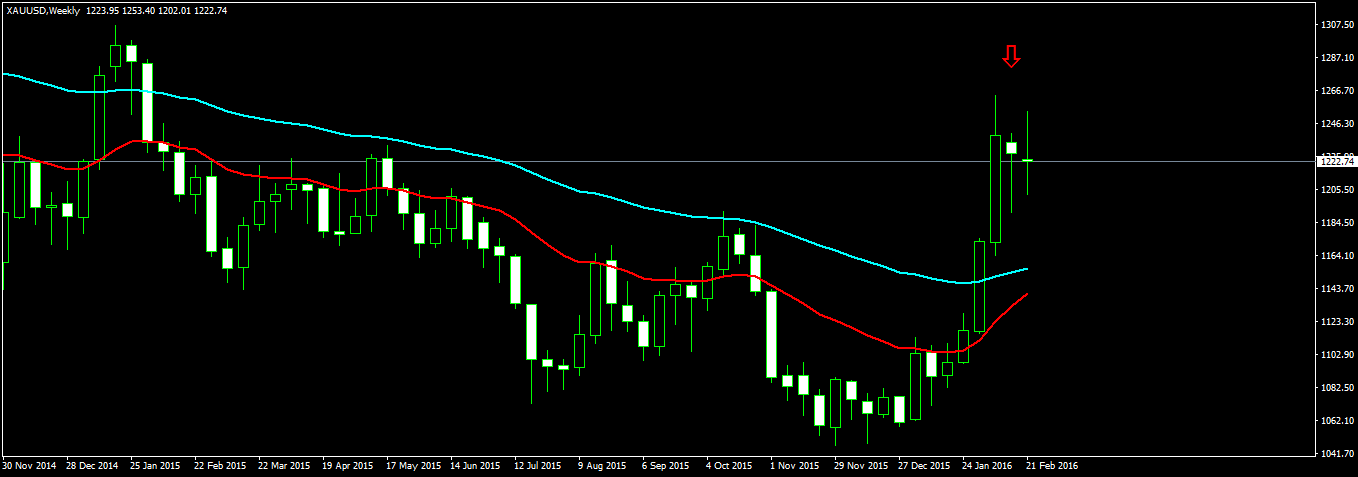
In the above screenshot, you can see the last weekly candle that has closed just below the down red. This weekly candle is technically known as the Long Legged Doji. Long Legged Doji is a powerful trend reversal signal. Basically it shows the indecision in the market when the bulls and bears can’t decide in which direction the market is going to move. As you can see price moved up during the week then it fell down and then again moved up and closed almost close the opening price. This is the characteristics of a Long Legged Doji Pattern which is a strong trend reversal signal.
A Long Legged Doji has got big upper and lower shadows and a very small body with the closing price almost equal to the opening price. This is a signal of indecision in the market showing that the bulls and bears are in equilibrium and neither of them are able to move the market either up or down. Watch this video that explains the significance of a Long Legged Doji!
This is another good video that explains what happens when a Long Legged Doji!
Now when this pattern appears on the weekly chart, it is a much more powerful signal meaning the downtrend will be much more strong. When this pattern appears on the daily chart, it also means a reversal but the strength of the reversal can be less strong as compared to when this pattern appears on the weekly chart.
Candlestick patterns are very important technical analysis tools. One of the most important candlestick trend reversal pattern is the Doji. There are many types of Doji Patterns. In this post we talked about the Long Legged Doji and explained in detail what it means when it appears. The long upper and lower shadows mean there was high volatility in the market during the week. But since the open and close of the candle are almost equal it means indecision in the market.
Candlestick pattern show you the market sentiment for a particular period of time. The shape of the candlestick shows what the buyers and sellers had been doing in that period. As said above a Doji means indecision in the market. Both buyers and sellers tried to push the market in their direction but failed and the market ended where it had started. Now keep this mind this Doji Candlestick Pattern works on all timeframes whether it is the 1 minute, 5 minute, 15 minute, 30 minute, 1 hour, 4 hour, Daily, Weekly and Monthly. So whenever you spot this pattern always take note. It means a reversal.
Appearance of this Long Legged Doji Pattern on the weekly XAUUSD chart, it is time to take profit and start looking for a short entry on the gold market.
Another important thing that we want to point out is that if you take a look at the gold weekly chart screenshot above you can see the red line which is EMA 21 below the aqua line which is EMA 55 so the downtrend is already strong on XAUUSD. Price tried to rally up in the last 12 weeks and finally broke above EMA 55 but couldn’t sustain the rally. EMA 55 is still above EMA 21 which means the downtrend is still there. Long Legged Doji coupled with the inside bar appearing in the last 3 weekly candles means the downtrend is going to resume and gold price will go below the $1000 per ounce level as the last time gold had found support at $1043 per ounce level some 12 weeks or 3 months back. This rally was just a retracement so this time gold will be able to break the $1000 per ounce psychological barrier.