In this post, we will discuss how we are going to use fibonacci levels to confirm the divergence signals that we use in our swing trading system. I hope you have read my post where I had explained my divergence based swing trading system for H4 timeframe. If you haven’t, please read it now and then come back to this post. Now we are going to add additional indicators to confirm the divergences signals that we use to trade on H4 timeframe. Divergence is a leading signal unlike moving averages and candlestick that are lagging. Using leading signals means we will be ahead of the crowd in entering the trend and then exiting the trending. When we trade on H4 timeframe, we get ample of time to make the entry and the exit decision. Read the post below where I explain how I use fibo levels to confirm the divergence signals. These fibo levels also show me the areas of strong support and resistance where price action has a high probability of bouncing off. With practice it does not take more than 30 minutes daily to know where the price is heading on H4 timeframe. A swing trade on H4 timeframe can continue for a few weeks. So once you are in a trade, you don’t need to do much monitoring.
What we want is to add another leading indicator to our arsenal that confirms the divergence signal for us. That other leading indicator is the Fibonacci Levels. Yes, fibonacci levels are widely used by professional traders and they are strong leading indicators. When price bounces from either the 38.2%, 50% and 61.8% levels, it is a strong signal that the retracement is over and the trend is going to resume itself. However just like candlesticks, you cannot use these fibonacci levels alone in trading. You need to use them in conjunction with other indicators like the MACD and the Stochastic. This is precisely what we will do when we add these fibonacci levels to our divergence based swing trading system.
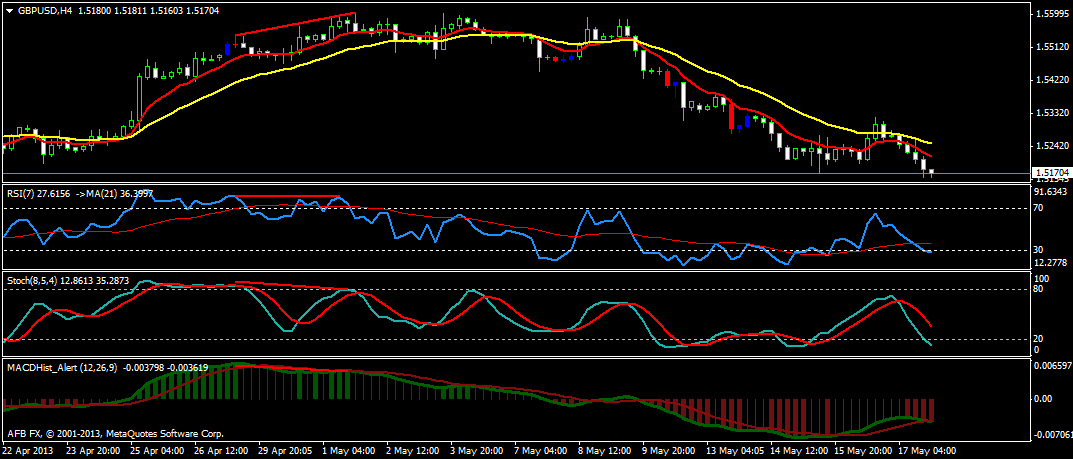
In the above screenshot, a bearish divergence pattern is appearing on the GBPUSD H4 chart.The date is 1st May. Can we further confirm this signal before we enter into a short trade. Yes, we can rather we should always confirm this signal further with another indicator before we enter into a short trade. Take a look at the following daily chart screenshot.
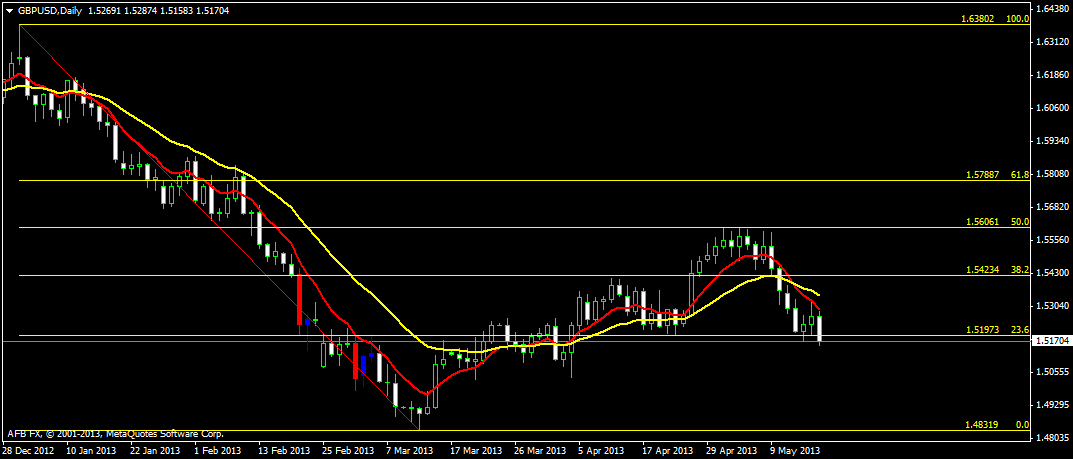
What we have done is connected the most recent swing high with the swing low and drawn the fibonacci levels. MT4 automatically draws these levels so you don’t need to worry about them. Take a look at the 50% level. On 1st May, price bounced off from that exact level which was pricely 1.5606. Next day it couldn’t break that level and made a high which was 1.5590. The third day also it couldn’t break it and made a high of 1.5600. This is a strong indication that price is not able to break above this 50% fibo level.
So the divergence pattern that is appearing on the H4 timeframe as shown in the first screenshot is being strongly confirmed by the price being bounced back by 50% fibo level. We entered into a short trade at 1.5582. Our risk was 24 pips. We continue in the trade as there is no bullish divergence pattern appearing yet on the H4 timeframe as shown in the first screenshot above. Now take a look at the following screenshot.
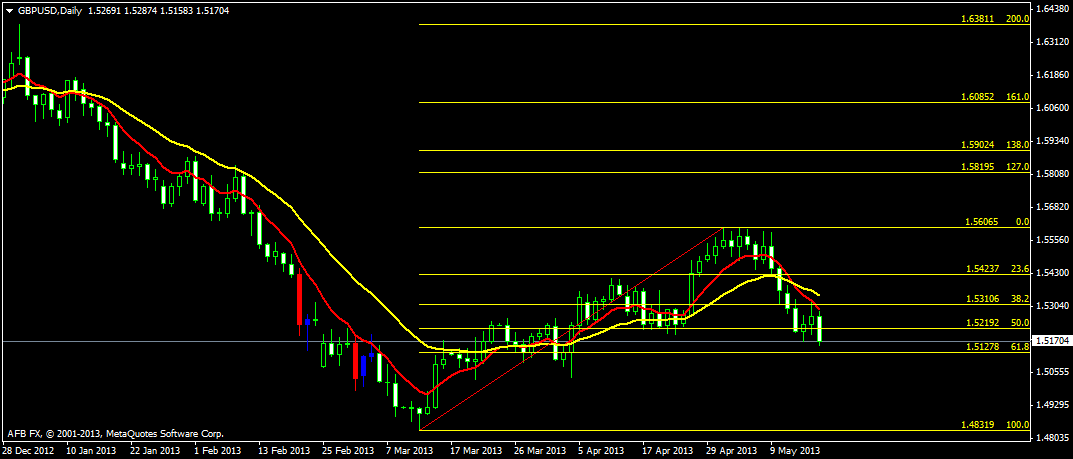
As you can see in the above screenshot, we connected the last swing low with the swing high this time. MT4 automatically drew the fibonacci levels. A divergence pattern is in the process of being formed on H4 timeframe. If you take a look at the above screenshot, price is right now 1.5170 while the 61.8% fibo level is at 1.5127. So next week the price is going to bounce of this level before a bullish divergence pattern appears. Right now we are in a profit of 412 pips. We had entered into a trade on 3rd May and today it is 18th May as I am writing this post. The price is going to touch the 61.8% fibo level which is at 1.5127. So you can see by using fibonacci levels, we can predict the important areas of support and resistance where price action has got a high probability of bouncing off. Now it is always a good idea to join the swing low and the swing high or the swing high and the swing low of a long term trend. This is precisely what we did on the daily timeframe. Read this Investopedia article on how to avoid top 4 fibonacci retracement mistakes. We also use Fibonacci Projections and the Fibonacci Extensions in confirming our signals. More on that in later posts. Download this FREE PDF that explains how to set these Fibo Levels properly on your MT4 platform as there are some shortcoming in the default fibonacci levels on MT4.