Many thought EURUSD will plunge to parity. Many analysts thought that EURUSD downtrend will continue for a long time. But things seems to be turning now. EURUSD seems to be finding a floor and is no longer falling down easily. Take a look at EURUSD weekly chart below. You can see a solid double bottom pattern also known as the W pattern. Just look at the last few candles on the weekly chart and you will find the W pattern visible. This pattern has held. You can see 2 bullish candles that are confirming this double bottom pattern.
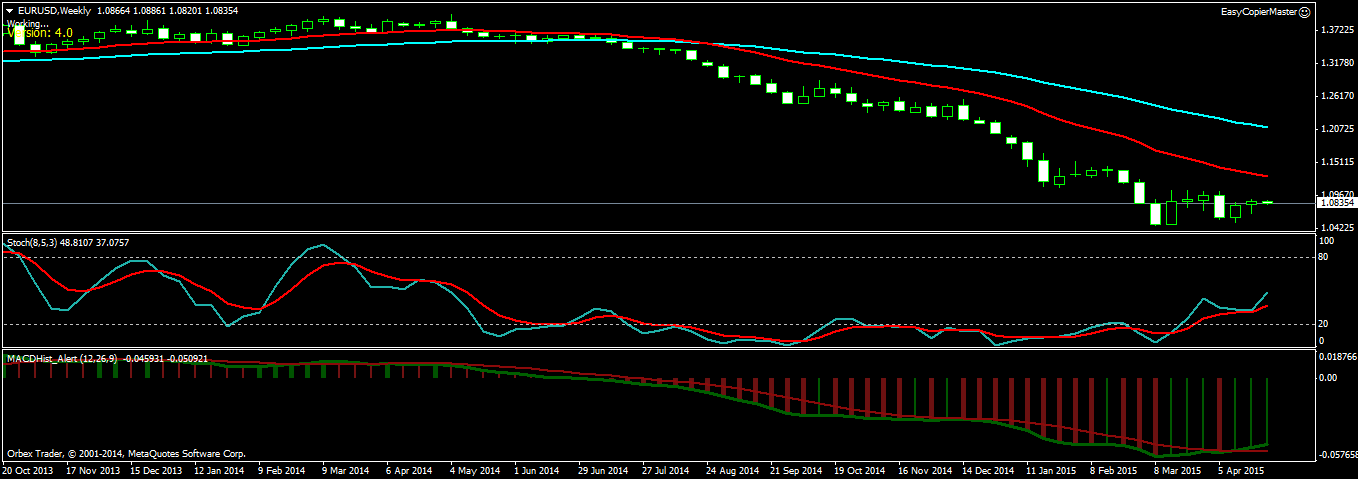
You can also see a strong bullish divergence on the weekly chart. So get ready for an uptrend to start on EURUSD. The downtrend that started last year is over now. Stop thinking that EURUSD will reach parity. Parity is no more possible as EURUSD will move up and up. Now keep this in mind GBPUSD follows EURUSD. So GBPUSD will also show an uptrend now. Take a look at this M30 chart below.
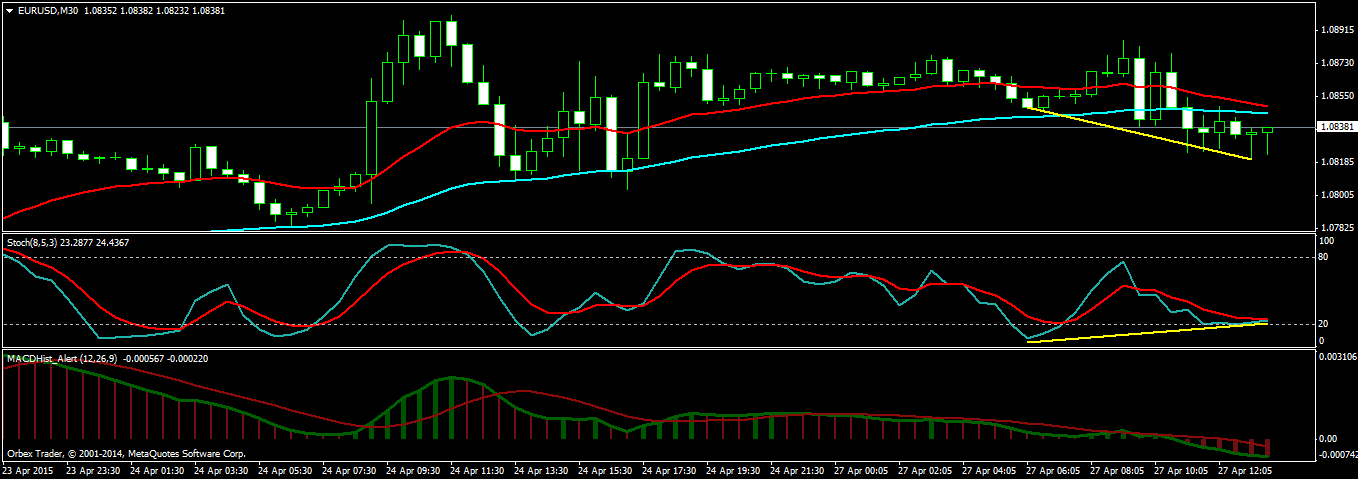
A strong bullish divergence pattern is appearing. So what happened? Has EURUSD fundamentals changed? After its biggest slide since being created in 1999, the euro is finding a floor.
“Europe is surprising on the upside,” Robert McAdie, head of research and strategy at BNP Paribas SA, said in New York April 15. “If European growth continues to pick up, you’ll see the inflows going into Europe — like portfolio inflows — which will support the euro.”