Do you believe in Naked Trading?? Candlesticks are very important if you are a naked trader. Naked traders rely on candlesticks a lot. Just looking at the candlestick charts they can figure out in which direction price action plans to go. We are a strong believer in naked trading and we love to use candlesticks for making the trading decisions that includes putting the stop loss at the low of a candlestick.
If you are trying to develop a price action based EA then you need to know how you are going to model the candlesticks in MQL4. Correct modelling of candlesticks will help your EA make the right decisions. In programming always remember the adage, garbage in, garbage out. So if your modelling is not correct you will have an EA that will always make the wrong decisions.
Let’s suppose we want to have the high of the candlestick on H1 chart. Below is the code for the high of the candlestick on H1 chart.
double H1=NormalizeDouble(iHigh(Symbol(),PERIOD_H1,0),4);
Similarly the code for High, Low, Open and Close will be:
double O1=NormalizeDouble(iOpen(Symbol(),PERIOD_H1,0),4);
double H1=NormalizeDouble(iHigh(Symbol(),PERIOD_H1,0),4);
double L1=NormalizeDouble(iLow(Symbol(),PERIOD_H1,0),4);
double C1=NormalizeDouble(iClose(Symbol(),PERIOD_H1,0),4);
Now suppose you want to look back 2 candles. This will be the code for the candle that is 2
places before the present candle:
double O1=NormalizeDouble(iOpen(Symbol(),PERIOD_H1,2),4);
double H1=NormalizeDouble(iHigh(Symbol(),PERIOD_H1,2),4);
double L1=NormalizeDouble(iLow(Symbol(),PERIOD_H1,2),4);
double C1=NormalizeDouble(iClose(Symbol(),PERIOD_H1,2),4);
This will be the code for a candle 4 places before the present candle:
double O1=NormalizeDouble(iOpen(Symbol(),PERIOD_H1,4),4);
double H1=NormalizeDouble(iHigh(Symbol(),PERIOD_H1,4),4);
double L1=NormalizeDouble(iLow(Symbol(),PERIOD_H1,4),4);
double C1=NormalizeDouble(iClose(Symbol(),PERIOD_H1,4),4);
Now how do we know that this is a downtrend or an uptrend. Look at the screenshot below!
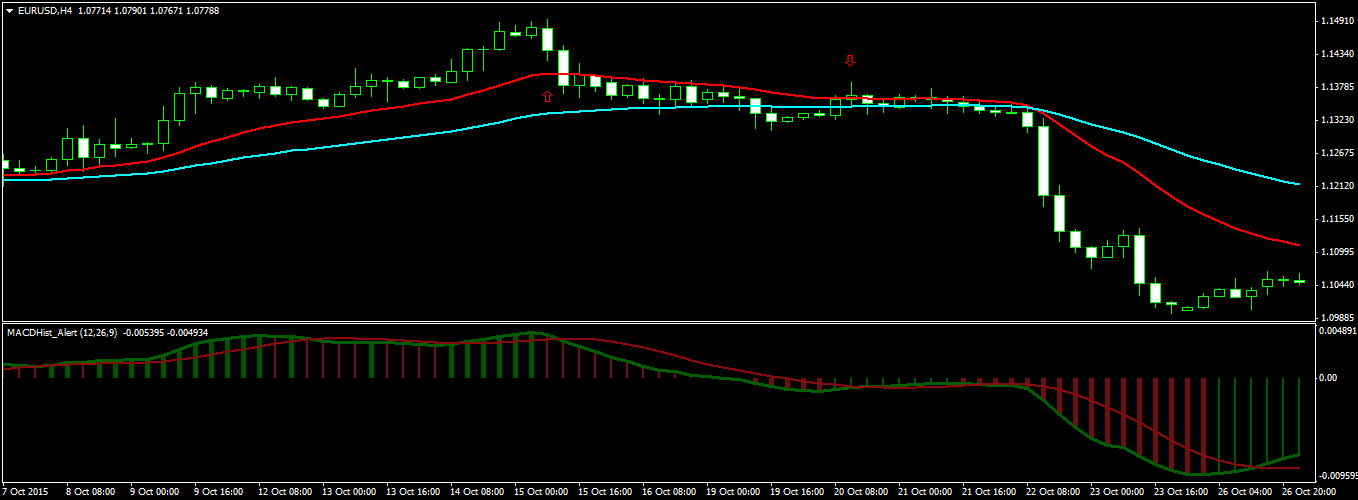
You can see in the above screenshot that EURUSD is in a strong downtrend on H4 timeframe. It is falling heavily. Red line (EMA21) is below Aqua line (EMA 55). So as long as the red line is below the aqua line, we have a downtrend and we should be looking for sell opportunities. In the same manner, as long as the red line is above the aqua line, we have an uptrend. Now we need to develop MQL4 code that implements it in our EA. Watch this youtube video that explains in detail how to code an EMA.
So we define the redEMA21 and the aquaEMA55 below:
double redEMA21=0;
double aquaEMA55=0
redEMA21= iMA( Symbol(), PERIOD_H4, 21, 0, MODE_EMA, MODE_CLOSE, 0);
aquaEMA55= iMA( Symbol(), PERIOD_H4, 55, 0, MODE_EMA, MODE_CLOSE, 0);
In the above code the last 0 means that the EMA value for the current H4 candle.
If redEMA21> aquaEMA55, we have an uptrend and if redEMA21< aquaEMA55, we have an downtrend. We need to make a function that compares these 2 values and tells us that we have an uptrend or a downtrend. Below is the function that will check for the uptrend or the downtrend;
int Trend (double EMA1 , double EMA2)
{
static int last_direction = 0;
static int current_direction = 0;
if(EMA1>EMA2) current_direction = 1; //uptrend
if(EMA1<EMA2) current_direction = 2; //downtrend
if(current_direction != last_direction) //trend has changed
{
last_direction = current_direction;
return (last_direction); }
else
{
return (0);
}
}
So first we use this function to check the direction of the trend and then we look for the bullish candlestick pattern that forms right on either red line or the aqua line in case of an uptrend. In case of a downtrend we look for a bearish candlestick pattern right on the red line or the aqua line. This is how we are going to look for a good entry. The exit will be when we spot an inside bar pattern.