Gold rallied hard in the last few weeks. Many months back we had given you an intraday signal when we showed you the bullish divergence appearing on H1 chart ahead of the FOMC meeting minutes release. You can read that post if you are not familiar with how to spot divergence signals. Now we give you a long term signal. Gold XAUUSD rally that had been going strong for the past few weeks is losing steam. Take a look at the following XAUUSD weekly chart.
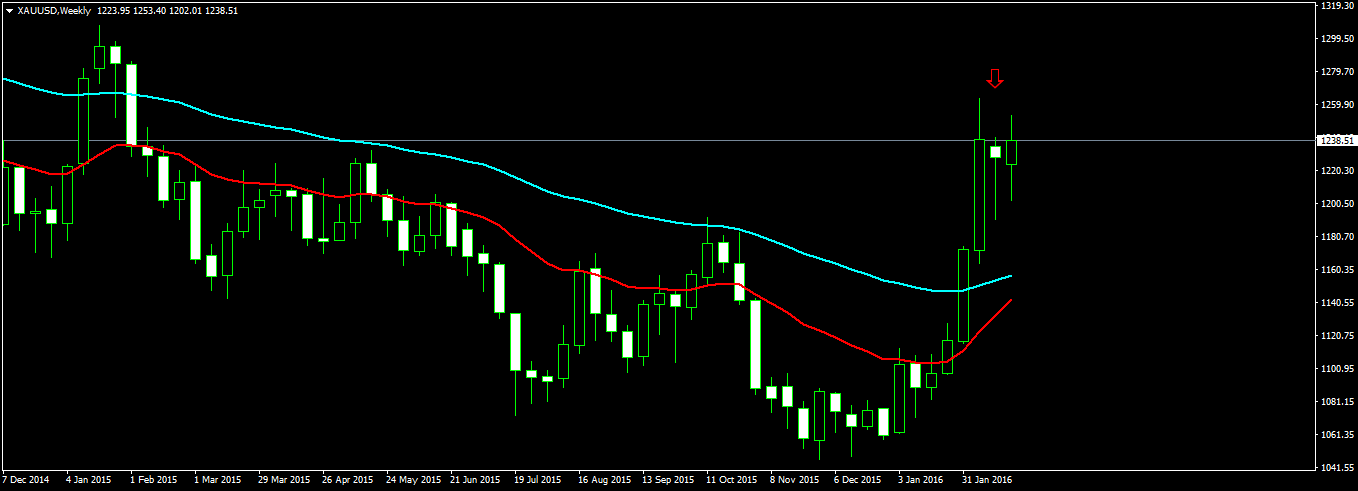
You can see in the above XAUUSD Weekly Chart an inside bar just below the red arrow. This inside bar had been formed last week. This week gold again rallied but couldn’t break above the resistance level of $1263.44 that had been touched 2 weeks before. Now take a look at XAUUSD daily chart below to further confirm what is happening.
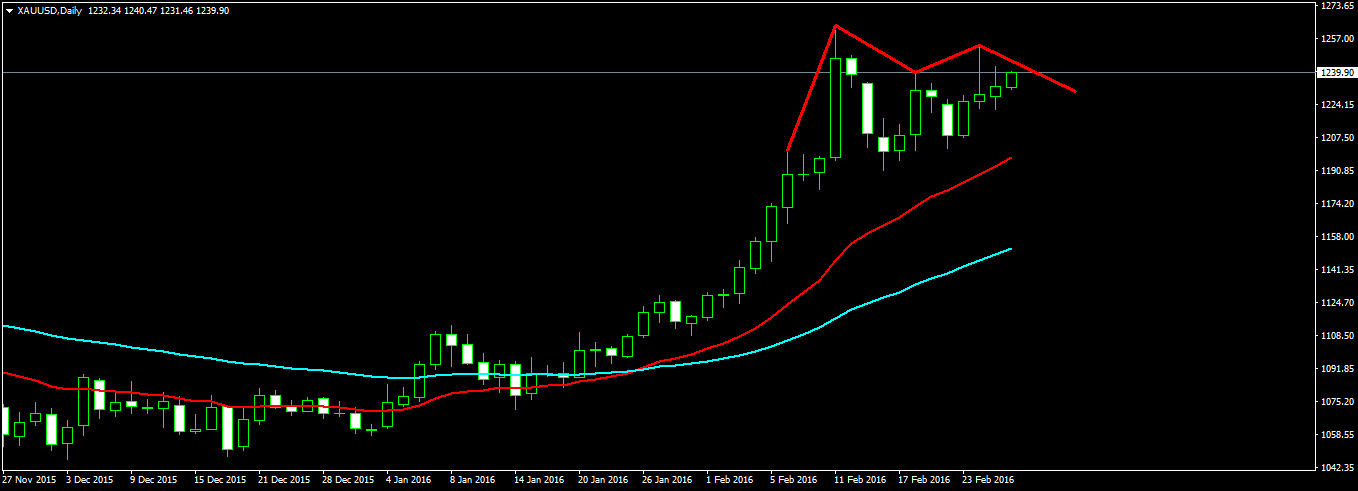
In the above daily chart you can see the M pattern also known as the Double Top Pattern marked. Now this M pattern is not complete yet. You can see today’s daily candle looking bullish. When the daily candle closes today you will have a clear picture of what the gold market is planning. If today’s daily candle is bearish than you have the M pattern confirmed. If it is bullish but is unable to break the high of $1263 than you should wait for the close of Monday daily candle next week. If that candle also fails to break the high of $1263 and finds strong resistance at that level, you have the M pattern also known as the Double Top Pattern confirmed.
XAUUSD Gold Long Term Outlook
So this was the outlook for the next few weeks. I forgot to mention that XAUUSD monthly candle is strongly bullish which means that in the next 6-12 months the uptrend can resume. Right now XAUUSD is touching EMA 50 on the monthly chart. If it finds resistance there it will be a signal that the downtrend can resume soon. But this downtrend is most probably going to be a retracement before gold starts rallying again. So what is the XAUUSD outlook for the next 6-12 months?
Gold outlook for the next 6-12 months depends on what happens to GBPUSD. With the price of the precious metal moving higher this week as sterling has plummeted, analysts are comparing gold’s moves to the European currency crisis in 1990s. Back then, the U.K. was forced to abandon a European currency peg in late 1992, famously helping investor George Soros make $1 billion by betting against the pound and the Bank of England.
Now this is what CNBC is saying. What CNBC is saying is that if Brexit takes place, gold will rally hard. Brexit means Britain exiting EU. Chances of Brexit? Very small. What we have shown you in our technical analysis above is that XAUUSD seems to be facing resistance on EMA 50 on the monthly chart. If this is true then gold should be bearish throughout 2016. However if Brexit takes place it will be a heavy below to the EU and investors will seek try to hedge the risk by running towards gold making gold rally hard.
Although some banks have shifted their outlook on gold, as global market uncertainty propelled prices up more than 17.5% on the year, one bank remains firm that prices will move lower.
So XAUUSD has got a strong chance to drop below $1,000 per ounce this year which is highly likely as we pointed out in our analysis above.