In this post I am going to code the ABCD chart pattern in Python for MT5 trading platform. We will then use that python script on MT5. ABCD chart pattern forms the basis of all the harmonic chart patterns like the Gartley pattern, Butterfly pattern, Crab pattern etc. You might have heard of the Elliott Wave Theory. Elliott Wave Theory stipulates that the market moves in five waves. Two are impulse waves and three are correction waves. Critics of Elliott Wave Theory say that market moves in 3 waves two are impulse and one is correction. This corresponds to our ABCD chart pattern. Read the post on USDCHF Extreme Event Monte Carlo.
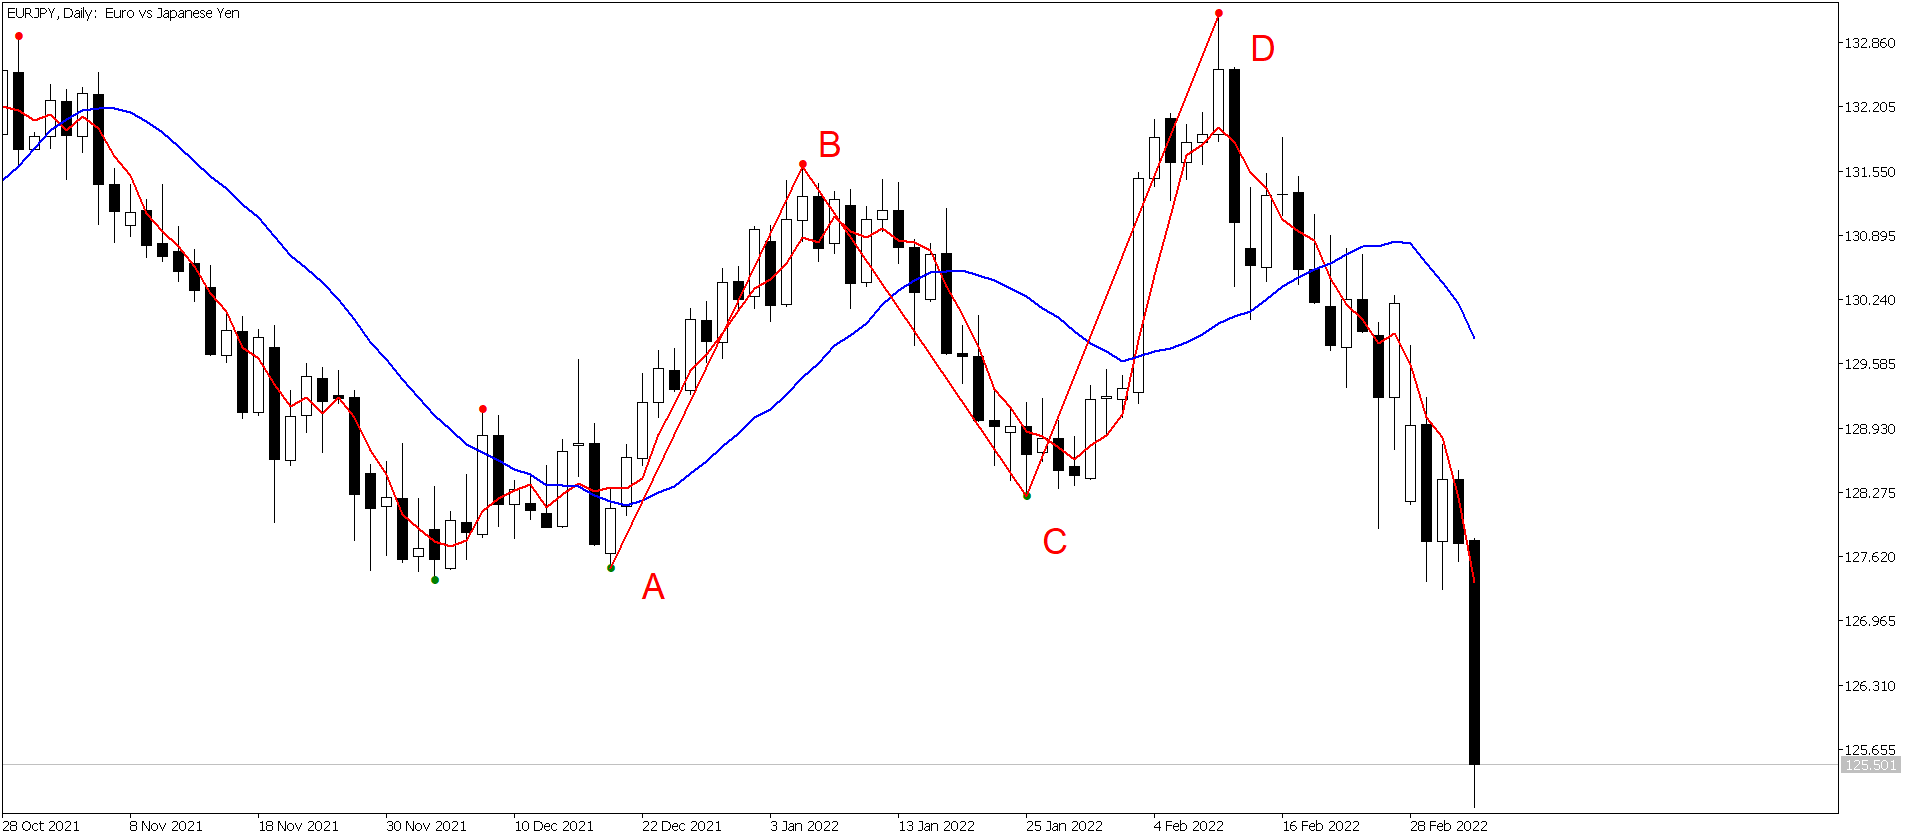
In the above image you can see EURJPY Daily Chart and a bearish ABCD chart pattern. After that there is a 900 pips move on the downside. You can see how powerful this chart pattern is. Learn how to code trailing stop loss in MQL5. Watch the video below where bearish ABCD chart pattern is predicting a big downside on Bitcoin Weekly Chart!
ABCD chart pattern was first identified by a person named H.M Gartley who wrote a book, ‘Profits in Stock Market’ in 1935. In that book he identified a chart pattern that now carries his name Gartley Chart Pattern. Gartley Chart Pattern comprises of this ABCD chart pattern. In fact all harmonic chart patterns comprise of this ABCD Chart Pattern. The book Profits in Stock Market by H.M Gartley is still selling on Amazon and used copies are being sold of more than $2.5K. So you can see people are still buying this book even after 100 years of its publication. Why? Because they think that the information provided in the book is valuable. Below is another video on bullish ABCD chart pattern on GBPJPY H4 chart.
From the above two video you can guess if you can correctly identify ABCD chart pattern on higher timeframes like H4, H6, H8, H12 and D1 means a big move like 200-300 pips. In this post we will dissect the ABCD Chart Pattern and then code it in python. After that we are going to backtest it and see what is the actual winrate if we trade with this chart pattern. Can we trade ABCD chart pattern? The backtest will tell us can we. We will build a trading strategy around this ABCD chart pattern and backtest it and see how it performs. By the way ABCD pattern is also known as AB=CD chart pattern. Learn how to use dynamic time wrapping in trading.
Connect Python with MT5
First we need to connect with MT5 and download the data. Let’s do it now! Install MetaTrader5 api using pip install. This api has been provided as a pypi package from the MetaQuotes Corporation the maker of MT5. We first define the list of currency pairs that we need to scan each time we want to check for ABCD chart pattern. After that we define the rates function that is going to make the connection to MT5 and download the most recent bars. We tell the function how many bars we want. It can be 100 bars. It can be 200 bars. Now you can see we can easily connect python with MT5. This is something awesome!
Pip Function
We also need to define the pip function that tells the size of pip. It depends on the currency pair. For pairs like EURUSD and GBPUSD pip is 0.0001. But for JPY pairs like USDJPY, EURJPY, GBPJPY etc pip is 0.01. We will need this pip function when we define the Swing Reversal Algorithm.
pairs=["EURUSD","GBPUSD", "USDCAD", "USDJPY", "NZDUSD", "AUDUSD",
"USDCHF", "GBPJPY", "EURGBP","EURJPY","EURAUD", "EURNZD", "EURCHF",
"EURCAD", "GBPAUD","GBPNZD","GBPCAD", "GBPCHF","CHFJPY","CADJPY",
"NZDJPY","AUDJPY", "AUDNZD", "AUDCAD", "NZDCAD","NZDCHF","AUDCHF","CADCHF"]

#download the data
def rates(currency_pair, time_frame, bars):
    #establish connection to MetaTrader 5 terminal
    if not mt5.initialize():
        print("initialize() failed, error code =",mt5.last_error())
        quit()
    # get 100 bars from the required timeframe
    rates = mt5.copy_rates_from_pos(currency_pair, time_frame, 0, bars)
    # shut down connection to the MetaTrader 5 terminal
    mt5.shutdown()
    # create DataFrame out of the obtained data
    rates_frame = pd.DataFrame(rates)
    return rates_frame


def pip(currency_pair):
    if currency_pair in ["USDJPY", "GBPJPY", "EURJPY", "CHFJPY","CADJPY", "NZDJPY","AUDJPY"]:
        return 0.01
    else:
        return 0.0001
Above we have defined the list of currency pairs that we will scan for the ABCD pattern. Now it is essential that we define the Swing Reversal Algorithm. We first define the swing reversal. It can be 40 pips, it can be 70 pips it can be 100 pips. Why we need to define the swing reversal?
Swing Reversal Algorithm
Swing Reversal is the price move that we will consider to constitute a swing reversal. So if we define swing reversal to be 40 pips, that means if GBPUSD price moves 40 pips in the down direction a down swing has started. As long as the price does no move up more than 40 pips, we have a down swing continuing. But when price moves in the up direction more than 40 pips the down swing ends and the up swing starts. Read the post on 42-252 SMA Python Trend Trading Strategy.
#swing reversal algorithm
def swing_point(df, reversal):
    """Calculate the Swing Reversal Points with a specified
        reveral amount in pips
    """
    swing=[]
    for i in range(1, df.shape[0]):
        if df.high[i] > df.high[0]:
            x=(df.high[i], i, -1)
            swing.insert(len(swing), x)
            direction=-1
            j=i
            break
        elif df.low[i] < df.low[0]:
            x=(df.low[i], i, 1)
            swing.insert(len(swing), x)
            j=i
            direction=1
            break
    for i in range(j+1, df.shape[0]):
        if direction==-1:
           if df.high[i] > swing[len(swing)-1][0]:
               x=(df.high[i], i, -1)
               swing[len(swing)-1]=x
           elif (swing[len(swing)-1][0] - df.low[i]) > reversal:
               direction=1
               x=(df.low[i], i, 1)
               swing.insert(len(swing), x)
        elif direction==1:
            if df.low[i] < swing[len(swing)-1][0]:
                x=(df.low[i], i, 1)
                swing[len(swing)-1]=x
            elif (df.high[i]-swing[len(swing)-1][0]) > reversal:
               direction=-1
               x=(df.high[i], i, -1)
               swing.insert(len(swing), x)
    return swing
This Swing Reversal Algorithm is very important. There is another method to identify the swings. Did you read the post on how to do systematic trading using artificial intelligence.
Fractals of N Order
Fractals are a chart pattern that get repeated on all timeframes. A fractal is formed when there is a swing high or a swing low. A fractal of order two is formed when the candle high is higher than the highs of the two adjacent candles or the low of the candle is lower than the lows of the two adjacent candles. Most of the time I use fractal of order 5. Fractal of order 5 means a candlestick where the high is higher than the highs of 5 bars on either side. This will be fractal of order 5 high. Fractal of order 5 low will be candlestick with low that is lower than the lows of 5 candlesticks on either side. We can use fractals of order 13, fractals of order 21 whatever suits us. Learn how to use NNET log linear models in trading.
#fractals of dimension n
def fractal_list(df, n):
    """Calculate Fractals of order n
    """
    swing=[]
    for i in range(n, df.shape[0]-n):
        if((df.high[i] > df.high[i-n:i].max()) and (df.high[i] > df.high[i+1:i+n+1].max())):
            x=(df.high[i], i, -1)
            swing.insert(len(swing), x)
            if(len(swing) > 1 and swing[len(swing)-1][2]==-1):
                if(swing[len(swing)-2][2]==-1):
                     if(swing[len(swing)-1][0] >= swing[len(swing)-2][0]):
                         swing.pop(len(swing)-2)
                     elif(swing[len(swing)-1][0] < swing[len(swing)-2][0]):
                         swing.pop(len(swing)-1)
        elif((df.low[i] < df.low[i-n:i].min()) and (df.low[i] < df.low[i+1:i+n+1].min())):
            x=(df.low[i], i, 1)
            swing.insert(len(swing), x)
            if(len(swing) > 1 & swing[len(swing)-1][2]==1):
                if(swing[len(swing)-2][2]==1):
                     if(swing[len(swing)-1][0] <= swing[len(swing)-2][0]):
                         swing.pop(len(swing)-2)
                     elif(swing[len(swing)-1][0] > swing[len(swing)-2][0]):
                         swing.pop(len(swing)-1)
        if(len(swing) > 1):
            if(swing[len(swing)-1][2]==-1 and swing[len(swing)-2][2]==1):
               if( swing[len(swing)-2][0] > swing[len(swing)-1][0]):
                   swing.pop(len(swing)-2)
            elif(swing[len(swing)-1][2]==1 and swing[len(swing)-2][2]==-1):
               if( swing[len(swing)-2][0] < swing[len(swing)-1][0]):
                   swing.pop(len(swing)-2)
    return swing
Fractals have a problem. We will have false fractals also. This happens when a fractal high is made and then price breaks the fractal high high. In the above fractal algorithm, I have catered for that possibility. Everytime we will download 200 recent bars and then scan them for fractals. Now that we have done that we need to define Fibonacci Projections.
Fibonacci Projections
Fibonacci Retracement, Fibonacci Expansion and Fibonacci Projections are used a lot by day traders. Somehow they love fiboancci levels. We can use Fibonacci levels but we must look for confirmation before we take action on them. Coding Fibonacci Projections is not that difficult. Just keep in mind Fibonacci Projections are different from Fibonacci Retracement. In retracement we have a high or low and then the price retracing towards that.
In Fibonacci projections we try to project the swing from the high and low in the direction of the previous swing. Suppose we have a swing high then we we will be projecting the last swing in the down direction. If we have a swing low, we will be projecting last swing in the up direction. By the last swing, I mean the swing before the last swing. Can we use AR Models in trading?
#define fibonacci projections
def fibonacci_projections(c, ab, dHigh, dLow,  sr):
    if (sr==1):
        if(c + 0.618*ab < dHigh and c + 0.618*ab > dLow):
            return -1
        elif(c + ab < dHigh and c + ab > dLow):
            return -1
        elif(c + 1.27*ab < dHigh and c + 1.27*ab > dLow):
            return -1
        elif(c + 1.618*ab < dHigh and c + 1.618*ab > dLow):
            return -1
        elif(c + 2.0*ab < dHigh and c + 2.0*ab > dLow):
            return -1
        elif(c + 2.618*ab < dHigh and c + 2.618*ab > dLow):
            return -1
        elif(c + 3.0*ab < dHigh and c + 3.0*ab > dLow):
            return -1
    elif (sr==-1):
        if(c - 0.618*ab < dHigh and c - 0.618*ab > dLow):
            return 1
        elif(c - ab < dHigh and c - ab > dLow):
            return 1
        elif(c - 1.27*ab < dHigh and c - 1.27*ab > dLow):
            return 1
        elif(c - 1.618*ab < dHigh and c - 1.618*ab > dLow):
            return 1
        elif(c - 2.0*ab < dHigh and c - 2.0*ab > dLow):
            return 1
        elif(c - 2.618*ab < dHigh and c - 2.618*ab > dLow):
            return 1
        elif(c - 3*ab < dHigh and c - 3*ab > dLow):
            return 1
Now that we have the fibonacci projections we can define the abcd pattern using the two algorithms.
ABCD Chart Pattern
ABCD Chart Pattern has some features. A B C and D are four swing points. In the case of bullish ABCD pattern, A should be above B C and D. AB is the first up swing. We will be projecting AB swing down from C point. This will give us the projected CD leg. D point should confirm this otherwise this is not a bullish ABCD chart pattern.
Similarly in bearish ABCD pattern, A should be below B C and D. AB is the first swing down and we will be projecting it up from C. This will give us the CD leg. D swing should confirm with this projection if this is an ABCD chart pattern. Ideally C should be a 38.2% or 61.8% retracement from B. But we can relax this requirement and still get a valid ABCD chart pattern. Learn how to trade the US Presidential Elections.
#ABCD chart pattern with swing points
def abcd_s(currency_pair,time_frame, reversal_size, bars=200):
    df=rates(currency_pair, time_frame, bars)
    reversal=pip(currency_pair)*reversal_size
    swings=swing_point(df, reversal)
    #if the swing points are less than 4
    if(len(swings) < 5):
        return 0
    swings.reverse()
    D=swings[1]
    C=swings[2]
    B=swings[3]
    A=swings[1]
    dHigh=df.high[(D[1]-1):(D[1]+2)].max()
    dLow=df.low[(D[1]-1):(D[1]+2)].min()
    #if A is a pivot low
    if(A[2]==1):
        if(A[0] < B[0] and B[0] > C[0] and A[0] < C[0] \
            and C[0] < D[0] and B[0] < D[0]):
            AB=B[0]-A[0]
            if(fibonacci_projections(C[0], AB, dHigh, dLow, 1)==-1):
                return -1
    #if A is pivot high
    elif(A[2]==-1):
        if(A[0] > B[0] and B[0] < C[0] and A[0] > C[0] \
            and C[0] > D[0] and B[0] > D[0]):
            AB=A[0]-B[0]
            if(fibonacci_projections(C[0], AB, dHigh, dLow, 1)==-1):
                return 1
    return 0
This was the ABCD chart pattern using the Swing Reversal Algorithm. Now with fractals. We can also identify ABCD chart pattern using fractals. Below I have provided the code for identifying the ABCD chart pattern with fractals. We will be using fractal of order 5. The pattern gets confirms after 5 bars. I didn’t use higher order fractals like 13. If I had used higher order fractal like 13, the pattern would have got confirmed after 13 bars. Both swing reversal and fractals complement each other. Sometimes fractals find an ABCD chart pattern and other times swing reversal algorithm finds the ABCD chart pattern.
#ABCD chart pattern with fractals
def abcd_f(currency_pair, time_frame, n, bars=100):
    df=rates(currency_pair, time_frame, bars)
    swings=fractal_list(df, n)
    #if we have less than 4 fractals in the list
    if(len(swings) < 4):
         return 0
    swings.reverse()
    D=swings[0]
    C=swings[1]
    B=swings[2]
    A=swings[3]
    dHigh=df.high[(D[1]-1):(D[1]+2)].max()
    dLow=df.low[(D[1]-1):(D[1]+2)].min()
    #if A is a pivot low
    if(A[2]==1):
        if(A[0] < B[0] and B[0] > C[0] and A[0] < C[0] \
            and C[0] < D[0] and B[0] < D[0]):
            AB=B[0]-A[0]
            if(fibonacci_projections(C[0], AB, dHigh, dLow, 1)==-1):
                return -1
    #if A is pivot high
    elif(A[2]==-1):
        if(A[0] > B[0] and B[0] < C[0] and A[0] > C[0] \
            and C[0] > D[0] and B[0] > D[0]):
            AB=A[0]-B[0]
            if(fibonacci_projections(C[0], AB, dHigh, dLow, 1)==-1):
                return 1
    return 0
ABCD Pattern Dashboard
Now we can define the dashboards. In the ABCD chart pattern dashboard we scan these timeframes for each currency pair in our list that I provided in the beginning of this post. We will scan H2, H3, H4, H6, H8, H12 and D1. Python is very fast and in a few seconds we have the dashboard that gives us the timeframe and the currency pair that is having ABCD chart pattern. Below is the dashboard using ABCD chart pattern based on fractals.
#dashboard for ABCD chart pattern
def dashboard_f():
    for pair in pairs:
        list=[]
        list.append(abcd_f(pair, mt5.TIMEFRAME_H2, 5))
        list.append(abcd_f(pair, mt5.TIMEFRAME_H3, 5))
        list.append(abcd_f(pair, mt5.TIMEFRAME_H4, 5))
        list.append(abcd_f(pair, mt5.TIMEFRAME_H6, 5))
        list.append(abcd_f(pair, mt5.TIMEFRAME_H8, 5))
        list.append(abcd_f(pair, mt5.TIMEFRAME_H12, 5))
        list.append(abcd_f(pair, mt5.TIMEFRAME_D1, 5))
        #dashboard[pair]=list
        print(pair, list)
This is the second dashboard. In this dasboard we use the ABCD chart pattern based on swing reversal algorithm. Coding this ABCD dashboard in MQL5 is much more tedious as compared to coding in python. Now that we can easily connect python with MT5, we should focus on python. Python is very powerful as a programming language as compared to MQL5. Learn python and you will be able to use all the machine learning and deep learning libraries in your trading strategies that are available in python.
def dashboard_s(reversal):
    for pair in pairs:
        list=[]
        list.append(abcd_s(pair, mt5.TIMEFRAME_H2, reversal))
        list.append(abcd_s(pair, mt5.TIMEFRAME_H3, reversal))
        list.append(abcd_s(pair, mt5.TIMEFRAME_H4, reversal))
        list.append(abcd_s(pair, mt5.TIMEFRAME_H6, reversal))
        list.append(abcd_s(pair, mt5.TIMEFRAME_H8, reversal))
        list.append(abcd_s(pair, mt5.TIMEFRAME_H12, reversal))
        list.append(abcd_s(pair, mt5.TIMEFRAME_D1, reversal))
        #dashboard[pair]=list
        print(pair, list)
This is it. We have something that we can now use in our trading. Now know this fact that ABCD chart pattern can be a good signal as well as it can be a bad signal. We can build a ABCD trading strategy. Before we trade live we need to backtest it. So we will do it. ABCD chart pattern can fail. Keep this in mind. There is no fool proof chart pattern. What we need to do is keep the risk low and try to trade this ABCD chart pattern. We will need to develop event based backtesting class for this backtest.