Artificial intelligence is increasing being used in developing systematic trading systems. In this post, we will discuss the broad outlines of how artificial intelligence is increasing being used in algorithmic trading and systematic trading. The first attempt at systematic trading was made by Japanese rice traders when they developed candlestick patterns. This happened long before the advent of computers in the 16th century when Japanese rice traders tried to give a visual representation to price. This visual representation of price led them to discover a number of price patterns like the doji, evening star, morning star, the engulfing pattern, harami and others that had some predictive powers. Candlestick patterns in way removed the irrelevant details about the price and compressed the daily market activity into the open, high, low and close (OHLC). Did you read the post on how to use dynamic time wrapping in trading?
In 19th century New York Stock Exchange started emerging as a major financial center as industrialization was rapidly taking place in US after the civil war. US was becoming the biggest steel manufacturer as well as railroad companies were crisscrossing across the continent at a rapid pace. NYSE was rapidly becoming the stock market where all the major stocks of these companies were being traded. In the last decades of 19th century, Charles Dow the editor of Wall Street Journal at that time introduced the concept of stock indexes such as the Dow Jones Index that comprised of 30 blue chip stocks being traded on NYSE. Dow Jones Index has been used as a barometer of investor sentiment at NYSE ever since. Charles Dow also introduced the subject of technical analysis and the concept of trends and moving averages that we now use in our daily trading. Read the post on how to code trailing stop loss in MQL5.
In 1950s, 1960s and 1970s new technical indicators got introduced like the MACD, RSI, ADX, Stochastic Oscillator, Commodity Channel Index and others. In 1970s, futures trading had become very popular. This is the time when Richard Dennis made a killing in the futures market with his Turtle Trading System. The first step in the development of systematic trading systems is the development of indicators. But the problem with traditional indicators based on moving averages is that they are lagging the price. So whatever signal you get, it is later. The chances are market move is over and you are late. In 1990s, computers became widely available. With the advent of computers, interest in developing artificial intelligence also gained momentum in 1990s. In 1990s another major trend also took place when major stock exchanges in the world started their journey to becoming fully electronic. By early 2000s the traditional open outcry pits had become part of history. Read the post on USDCHF extreme Monte Carlo Modelling.
In 1987 the first stock market crash in the electronic era took place. In 2010 the stock market experienced the first of a series of flash crashes. A flash crash happens when the market suddenly drops and there is no one to take the buy side. Somehow the market freezes for a few moments and price plunges into an abyss killing the accounts of many traders. Side by side a modern theory of finance was also developing in the academia. Market participants were considered to be rational. Markowitz developed the Modern Portfolio Theory and won the Nobel Prize for it. In the 1960s and 1970s Black Scholes Options Pricing Formula was also developed and the developers won the Nobel Prize. Read the post on a SMA Trend Trading Strategy.
Modern financial theory stipulates the markets as efficient and hard to predict. According to the modern financial theory price is just a random walk and we cannot predict price with much accuracy. What this means is that trading is a futile exercise and those who trade for a living should not make any extra normal returns. Debate on market efficiency raged for a few decades. Finance Professors argued that market efficiency means all available information getting incorporated into price pretty quickly so there is nothing a trader can do to predict. But legendary traders were proving the modern finance theory wrong by making millions in the market with their trading systems. Richard Dennis was among them. What these traders were doing was reacting to the market fast enough rather than trying to predict it.
Market Is A Complex Socioeconomic System
Sometime you feel finance theory is simply unable to explain market behavior. Finance Professors have rationalized a lot but majority of the time you will find them wrong when it comes to explaining and predicting market behavior. Now a days financial markets are being modeled as complex adaptive systems. Financial markets are nonlinear dynamical systems that interact at the local as well as global level. There are a number of feedback loops that feed on what is happening locally as well globally. It is difficult to isolate these local agents. But when many local agents interact a price pattern emerges. The system is constantly adapting and anticipating. So it becomes hard to predict the next move in the financial market. These local agents can be human as well as robots. Read the post on how to trade US Presidential Elections.
Trading And Robotics
Financial markets are somewhat akin to biological system. It took mathematicians a long time to come up with viable biological mathematical models like the ones used in genetics and evolutionary biology. On the other hand, automated trading systems have a lot in common with the modern day robotics. In robotics we talk about Autonomous Adaptive Agents. You must have read a lot about autonomous driving vehicles. Now a days a lot of work is being done on autonomous driving vehicles. Google, Apple and other big companies have invested heavily in developing autonomous driving software. The vehicle is loaded with sensors like cameras and radars. These cameras and radars act as sensors that feed input into the central control system which is a software.
A trading robot is just like any other robot. A trading robot is continuously fed with the tick and price data along with other data. This tick and price bars data is filtered using a number of indicators. These indicators interpret the tick and price bars and decided when to buy and sell. These buy/sell signals are fed into the Order Management System (OMS) that decides how much to invest in an order. This OMS then sends back the information to the control system. Take a look at my course Algorithmic Trading System Design.
Finite State Machines
You should have the concept of a Finite State Machine (FSM). A FSM is a markov process which has a finite number of states. At each point in time, the FSM can exist in any one of the defined state. When the timestamp is updated the FSM can tAn automated trading system also known as a trading robot is programmed as a finite state machine (FSM). As said above the price data is streamed into the FSM where the indicators are calculated. Once the indicator values have been calculated the control system of the trading algorithm makes the decisions according to the programmed algorithmic trading strategy. The trading algorithm is programmed as FSM so that it remembers the previous states as well as the current state and in case of disruption when a fault develops and the system malfunctions. Let me make this clear with an example. Suppose, the algorithmic trading system is trading on 1 minute chart. Suddenly the internet connection is lost. The internet connection is established again after a few minutes. When the internet connection is recovered, the trading algorithm should have a mechanism that tells it what state the FSM was and how it should proceed now. It is very important for the trading algorithm to be able to recover correctly from faults like loss in internet connection. This will ensure that the decision making process of the FSM is robust. This is important for you to understand. The strategy’s core logic is implemented as a FSM.
Trading Agents And Events
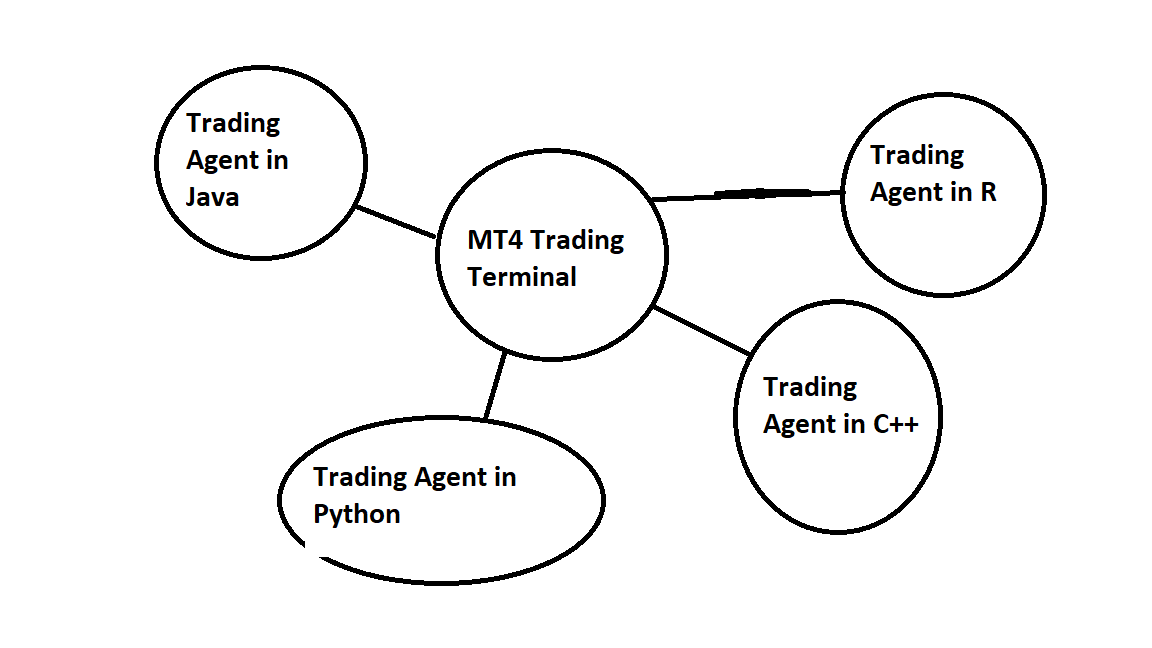
Trading agents are the building blocks of an algorithmic trading system. There can be a number of trading agents in an algorithmic system. Trading agents take events as inputs and update their states. Trading agents also communicate with each other. Events carry information. For example release of NFP Report can be an event. FOMC Meeting Minutes release can be also an event. So events represent information. A moving average cross can also be an event. So any information that is useful for the algorithm can be represented as an event. Hitting the stop loss can also be an important event as it tells the trading agent that the trade has been lost. Timestamps are very important for these events. Each trading agent is designed as a FSM having a number of states. Trading agent can only exist in those states.
A trading algorithm can have multiple trading agents. Each trading agent may trade only one instrument like a stock, futures contract or a currency pair. Trading agents can also communicate with one another. Communication becomes necessary as each the trading agent may like to know the state of other trading agents before opening a position. Modern financial markets are sentiment based and driven by the news in the short term. Bloomberg, Reuters, CNBC and other financial news services have streaming news services. Natural language processing (NLP) techniques are widely being used by the trading algorithms in processing these streaming news feeds. The trading algorithm should be able to understand the news significance whether it will impact price positively or negatively.
Algorithmic Trading Strategies
Trading strategies can be directional as well as contrarian. Trend trading and breakout trading are directional strategies. Mean reversion is a contrarian strategy. Most systematic trading algorithms use trend trading. Channel breakout strategies are still popular. A popular channel breakout trading strategies comprises using two channels one slow and the other fast. The slow channel is used for making the entry and the fast channel is used for making the exits. Most of these strategies use moving averages to detect the trend. When the price is above the moving average we say the price is in an uptrend and when the price is below the moving average we say the price is in a downtrend. All moving averages are low pass filters. Moving averages can be simple, exponential and adaptive. Adaptive moving average is an exponential moving average with an alpha that depends on price or volatility.
One of the most popular trend trading methods is to use two moving averages one slow and the other fast. The only problem with this approach is that most of the time moving averages are going to whipsaw meaning it will go above the other moving average slightly and then cross back again. Algorithmic traders use a Signal to Noise Ratio (S/N) to avoid the problem of whipsaw. Only those signals are taken that are above a certain S/N threshold. Now prices tend to rise slowly but fall rapidly in the case of equities, currencies and high yield bonds. On the other hand, investment grade bonds and commodities tend to do the reverse meaning their prices rise rapidly whereas fall slowly. This is particularly true for commodities prone to experiencing shortages. Mean reversion strategies are the exact opposite of the trend following strategies.
Let’s discuss the currency market. Currency market is an over the counter market that is open 24/5 meaning it is open from Monday to Friday and closed over the weekend Saturday and Sunday. On the intraday timeframes volatility shows certain patterns. The most pronounced pattern is low volatility before a breakout. Many algorithms love to trade this pattern. Another strategy involves constructing the Shadow Index. Shadow Index is used to trade breakouts and trends. When the market is ranging, shadow index is 1 and when it is trending, the shadow index is close to zero. Take a look at my course Markov Chain Monte Carlo Methods for traders.
Electronic Market Making and Liquidity
In the past market making was being done by the specialists. Financial markers have changed a lot since their transformation spurred on by technological progress. Open pit outcry is thing of the past and is replaced by electronic matching engines. Specialists play little role into providing liquidity to the market. Hedge funds have increased their role in providing the liquidity. Liquidity providing has become a very profitable business but only those firms who have the technological edge are able to make profit from the business of providing liquidity to the market. The introduction of computers has changed the traditional liquidity providing model. Now everyone is able to view the market order book but none is acting as a specialist whose job was the provide market making for particular stocks.
Everything is not visible on the order book as algorithms are used to hide orders. Iceberg orders are hidden from the order book and gradually revealed. Anyone can post limit orders to the order book. You need technological edge if you want to compete as your bids and offers should be highly competitive. Speed is of essence here.In the currency market, there are a number of competing ECNs and the market is segmented as the currency market is not centralized. There is no incentive for the banks who run these ECNs to open their segment of the market. There are many firms who use the market making model in their algorithmic trading strategies. These market making algorithmic trading strategies are also based on FSMs. A market making strategy is basically a mean reversion strategy. So when a breakout takes places the market making strategy loses money. Most forex brokers are using market making desk strategies to profit. Each client trade is added to the trade database.and data mining algorithms are used to determine which clients are better market predictors or have a predictable market behavior. This information is used to adjust risk in the position management system.
Combining Trading Strategies
We can combine trading strategies working on different instruments as well as we can combine trading strategies working on the same instruments. We combine a number of trading agents working on the same instrument into an aggregate trading agent. Modern Portfolio theory (MPT) is often used to combine trading strategies oftentimes with disastrous results. The reason is simple. MPT assumes that the risk and return are static numbers. In reality they are not. Co-variances and variances that are calculated are assumed to be static and constant over time which is simply not true. Volatility is not constant. Volatility keeps on changing and assuming that volatility will be constant like that in the Black Scholes Options Pricing formula is a recipe for disaster. Variances and co-variances likewise are constant changing and anything can happen any time. Take a look at the Quantopian algorithmic trading platform.
Now you need to keep this in mind. Trading agents whether they are human or robots are an integral part of the market. Once you start trading, your actions start affecting the market. Of course, if you are a small player with little capital, your actions will have small effect. On the other hand big players with deep pockets like the hedge funds and the big banks can have considerable effect on the market. So if you are a small trading agent, your impact will not be much on the market. But when you start taking large positions, don’t assume that there will be no impact on the market.
Order Management System
Order management system (OMS) can become quite complicated as the order can get rejected or executed with slippage. When the markets become highly volatile, brokers widen the spreads and the chances of your order getting rejected can become high. Take the case of stop orders. Stop orders do not exist on the machine engines of the order book. Stop orders are actually limit orders that are placed when the price gets triggered. So when the market moves fast, you can find the stop orders not getting filled as there is no one on the other side to fill the stop order. In the same manner, slippage results from the lack of liquidity. So the Order Management System (OMS) basically serves two important functions. It communicates orders from the trading agents to the broker and then informs about the fill results from the broker to the trading agent meaning it tells the trading agent whether the order got executed or rejected.
Lower timeframes are now being dominated by algorithmic trading system who are constantly competing for speed and execution. There is an arms race going on in the lower timeframes. What this means is that the patterns on the lower timeframes are transient and less stable as more and more efficient algorithms are trying to exploit the markets at lower timeframes. High frequency trading is an opportunity as well as a challenge. Trading algorithms should be robust enough to survive market regime change while at the same time they should have the capability to exploit good opportunities without getting blown in the process. This requires the use of Artificial Intelligence (AI) and Reinforcement Learning (RL). Reinforcement learning is a branch of AI that allows the algorithm to learn from its mistakes.
Swarm Trading Strategies That Adapt
Trading strategies are programmed as trading agents that operated independently and can communicate with one another. We know markets keep on changing. Market suddenly change direction reacting to good news or bad news. How do we deal with that? We program multiple strategies in each trading agent. The trading agent will select that most appropriate trading strategy based on a set of criteria. The trading agents run all the portfolio of trading strategies programmed into it in demo mode in real time and measure their performance. Those trading strategies that are performing well are chosen by the trading agent to trade the real account. Trading agents can also use reinforcement learning to improve a particular trading strategy. But the important question is how do we introduce feedback into our trading system that continuously drives it to adapt to the changing markets and give better performance.
Information is continuously being fed into the trading agent. The trading agent has to make optimal decisions taking the information fed into account. The trading agent should be able to observe the market regime. It should know the market regime at a particular point of time like whether the market is trending or ranging and adapt its trading strategies according to the market regime. The main fitness measure of a trading strategy is its performance. The primary goal should be to increase reward to risk and reduce drawdowns.
Trend trading can have a lot of whipsaw. The trading system should be able to reduce the whipsaw. Fitness Feedback Control is an important concept that decides when to switch on the trading strategy and when it switch it off. Feedback Fitness Control actually controls the risk taking of a trading strategy by turning it on and off by exploiting the favorable market regime and avoiding unfavorable market regime. Fitness Feedback Control is also known as Trading the Equity Curve. Trading the equity curve is used by some hedge funds. The concept of Fitness Feedback Control (FFC) forces the trading strategy to adapt to its own performance.
Trading Strategy Robustness Test
Markets keep on changing. A trading strategy may work or not work as the market changes. The robustness of a trading strategy is measured on a rolling basis. A fitness measure for the trading strategy is defined and then statistically measured over many intervals [T, t+t]. A static buy/sell strategy will have a robustness measure of zero as the positive ans negative slopes will cancel out on the average. So if the robustness measure of a trading strategy is 0.5, it means it will outperform the static trading strategy. As said above, all the trading agents which are infact trading strategies are continuously run on the demo account so that their performance is continuously being measured.So when we define a fitness measure for these trading strategies we are continuously measuring the fitness measure of each trading strategy. There is a fitness measure threshold. When the trading strategy fitness measure goes above that threshold, the trading strategy starts trading the live trading account and when the fitness measure of that trading strategy falls below that threshold, it stop trading the live account.
FFC (feedback fitness control) is an important parameter as said above that is measured continuously for each trading strategy. FFC tells is how well the trading strategy is performing under given market conditions. How do we measure the change in market regime? As long as the trading strategy is performing well, we say it is well adapted to the market regime. When its performance deteriorates, we say the trading strategy is out of sync with the market regime. When we need is a family of trading strategies that perform under different market regimes. Market regime is a technical term for the market change. Now markets are complex adaptive systems. FFC helps in avoiding market regimes when the performance of all trading agents is poor meaning no trading agent is well suited to trade that market regime. Instead of a threshold mechanism for choosing the trading agent, we can adapt a maximizing strategy. Maximizing strategy means choosing that trading agent that has the best performance for the moment.
Reinforcement Learning Swarm Intelligence
Now you might be wondering how do we choose the best performing trading strategy when we are looking at its past performance. Past performance is no guarantee for future performance. So how do we mitigate the risk of market regime shift when we change the trading agent. Here we can make use of reinforcement learning. Reinforcement learning is a branch of artificial intelligence which is a getting a lot of attention in the field of robotics. Robots continuously observe their environment and optimize their actions accordingly. This is exactly what we will do. We will use reinforcement learning to continuously monitor the swarm trading system and optimize it for best performance. Reinforcement learning continuously monitors the performance of the swarm trading system and rewards it when it take the right action and punishes it when it takes a wrong action. This behavior helps in improving the performance of the swarm trading system over time.
This reward maximizing behavior is achieved using exploration. Reinforcement learning depends of environment exploration a lot. This environment exploration helps in learning the best behavior that can maximize the reward for the swarm trading system. Now the swarm trading system is a bunch of trading strategies that work under different market regimes. We continue to develop new trading strategy that perform well under certain market conditions and add them to the swarm trading system. Transition from the world of paper trading and backtesting is very important as we are moving from the good world to the bad world of reality where the trading system that traded well on paper immediately starts losing money. There are many sources of friction in live trading that includes trading costs and slippage for small traders and market impact cost and liquidity for big players in the market.
When we have a big trade open order for example we have a trade of 100 standard lots. When we open a trade with 100 standard lots it will immediately impact the market. We need strategy that can reduce the trading cost for us. 1 pip on a standard lot costs $10. So 100 standard lots trading EURUSD with 1 pip spread means an immediate trading cost of 100*10=$1000. Now add slippage to your open trade order. Suppose the slippage has been 3 pips. So immediately when you open the trade you have a negative balance of $1000+$3000=$4000. Slippage is a result of poor liquidity in the market as a result your order is not executed immediately by the broker. Your algorithmic trading system should be able to minimize slippage by opening trades only when the market liquidity high and risk of slippage is low. Intraday market volatility is important when opening and closing trades. Intraday market volatility patterns can tell you how much slippage to experience at a particular time of the day. Placing limit orders is also problematic. Placing too big a limit order can have a repellent effect on the liquidity takers. Take a look at my course Algorithmic Trading System Design.